
Introduction
Most golfers would like to improve. However, without solid data, how do we know we are actually improving or what to work on? In my first two blogs this year (Time for Reflection and A Cunning Plan) I suggested how you might analyse “where am I now” and “where do I want to be?”
The next logical step is to measure your progress.
Broadly there are 4 main categories; fairways hit, greens in regulation (GIR), Scrambles (up and downs in 2 shots from under 30 yds) and average putts per round. You could also add course management and mental approach but I’ll save these for another day.
The Professionals
If we take a look at the top players in the world on the PGA tour, you might be surprised at the numbers and the highest achievers.
Fairways hit – leader – Jim Furyk -80% (11/14)
Greens in regulation – Jim Furyk – 78% (14/18)
Scrambles – Abraham Ancer – 76% (41/54)
Putts – Patrick Reid 1.68 or 30 putts per round
Lies Damned Lies and Statistics
Fairways hit
Now for every number there’s a counter argument. For example, when Jordon Speith won the British Open at Birkdale he deliberately missed certain fairways to give himself a better angle into the flag. Other pros will hit it as far as they can, find it and hit it hard again. Maybe, but for lesser mortals, hitting our second shots off the cut stuff is much easier than hacking back into play from the tall grass.
Green in Regulation
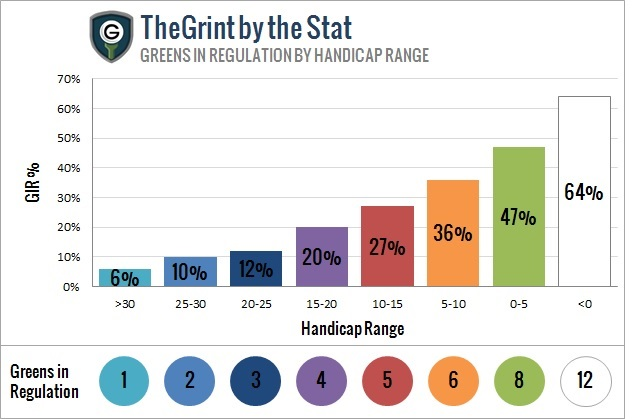
Source: www.thegrint.com
This chart gives us some idea of the number of greens we should aspire to be hitting on average each time we play. Most of you will be in the 1-5 GIR categories. Now you could have a prolific scrambling game relative to your handicap (i.e. get up and down a lot even if you’ve missed a green in regulation) but this chart does give you a clear, measurable goal.
Scrambles
For the mid to high handicapper this and putting are the areas where you can make the most marked improvements.
Putts
Probably the most under practiced element of our golf games but with most mid handicappers taking 36 putts plus, that’s a lot of shots with one club. Imagine if you could knock 3 or 4 shots off your average score just on the putting greens! Suggest you capture total number of putts and number of 3 putts per round.
How to capture the data
If you’re cash rich, then there are apps that will capture the data for you. “Shot scope” for example.
https://shotscope.com/uk/ About £125
If money is in short supply, try this:
- Devise a short hand for your score cards and create a spreadsheet at home on your computer
- A tick or cross next to the hole number will tell you if you hit the fairway or not. Also mark it with an L or R to denote misses left or right. The trend will become important.
- GIR – a tick or cross in column A as well as L, R, S for short and Lng for Long
- Scrambles – use column B for this. Give a value for the number of shots taken to hole out from 30 yds. Once home and populating your spreadsheet, a notes section would be good for the club you used where you were able to get up and down in 2 shots. Maybe you putted with a hybrid rather than the usual pitching wedge?
- Putts – total number per hole and capture 3 putts too (A one putt will also show the quality of your chipping and pitching)
Summary
Over time (suggest at least 10 rounds) some clear patterns should emerge and also some solid numbers to beat. Weather conditions will vary, but the more rounds you play, the more these anomalies are smoothed out.
Good luck and look forward to going through your spreadsheets and identifying the areas for improvement and most importantly, having a solid base to track your progress.
Thanks for reading my blog
07764 895 045